Bitcoin (BTC) Price Analysis: Bullish Continuation Signals
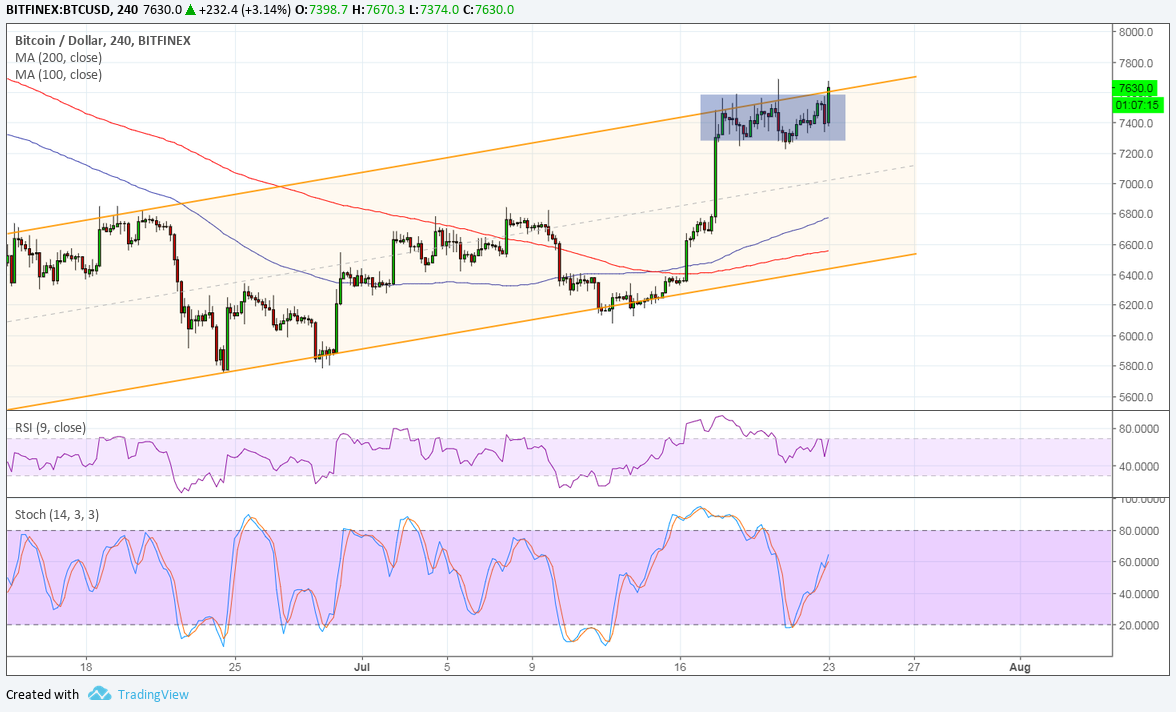
Bitcoin has recently formed higher highs and higher lows to create an ascending channel on its 4-hour chart. Price has been hovering at the top for quite some time, indicating that buyers continue to prop it up.
A bullish flag can be seen right at the top of the channel, and this is often seen as a continuation signal. If so, an upside break could lead to a rally that’s the same size as the flag’s mast. This spans $6,200 to $7,600 or around $600 in height.
The 100 SMA is above the longer-term 200 SMA to confirm that the path of least resistance is to the upside. This confirms that the uptrend is more likely to carry on than to reverse. The gap between the moving averages is widening to reflect stronger bullish momentum. These dynamic inflection points are also near the channel bottom to add support in a pullback.
RSI is pointing back up to reflect some bullish pressure but appears to be slowly making its way down. This could be indicative of exhaustion among buyers and a possible return in selling momentum. Stochastic is showing a clearer visual of heading higher so bitcoin might follow suit and push past the $7,700 barrier.
Bitcoin had another solid run in the previous week thanks to all the focus on institutional interest and FOMO among most traders. Whether this could be sustained in the days ahead or not remains to be seen, depending on how the next news cycle turns out.
Another set of updates on positive developments like investments in the space or acquisitions could bring more gains for bitcoin while negative news could lead to a pullback. As it is, investors seem optimistic that the industry could sustain a rebound in the coming months, possibly even bringing bitcoin to its price targets of at least $20,000 by the end of the year.
The post Bitcoin (BTC) Price Analysis: Bullish Continuation Signals appeared first on Ethereum World News.